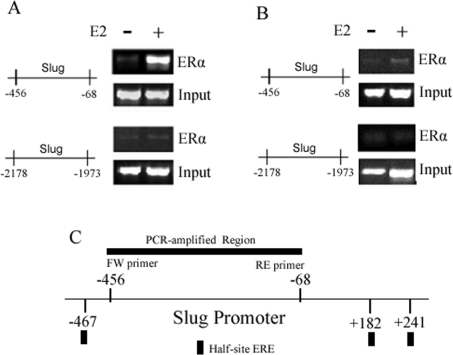
Figure 3. ChIP assays for ligand-activated ERα in association with the slug promoter.
(A) The ERα-positive MCF-7 cells were grown in Phenol-Red-free DMEM supplemented with 5% DCC-FBS for 48 h. After 12 h of serum starvation, the cells were treated with either ethanol vehicle (control) or E2 (100 nM) for 4 h. ChIP assays were performed by using an antibody directed against ERα. E2 treatment led to the recruitment of ERα to the −456 to −68 but not the −2178 to −1973 region of the slug promoter. (B) The ERα-negative MDA-MB-468 cells were similarly grown, treated and studied. There was no association of ERα to the −456 to −68 region of the slug promoter with E2 treatment. Input DNA was used to normalize results in both sets of experiments. (C) The schematic diagram depicts the location of the three half-site EREs found at positions −467, +182 and +241 in the slug promoter. Because these half-site EREs were only putative binding sites, we amplified a region flanked by these EREs which would be immunoprecipitated if the transcriptional inhibitory complex were bound to any one of them.

