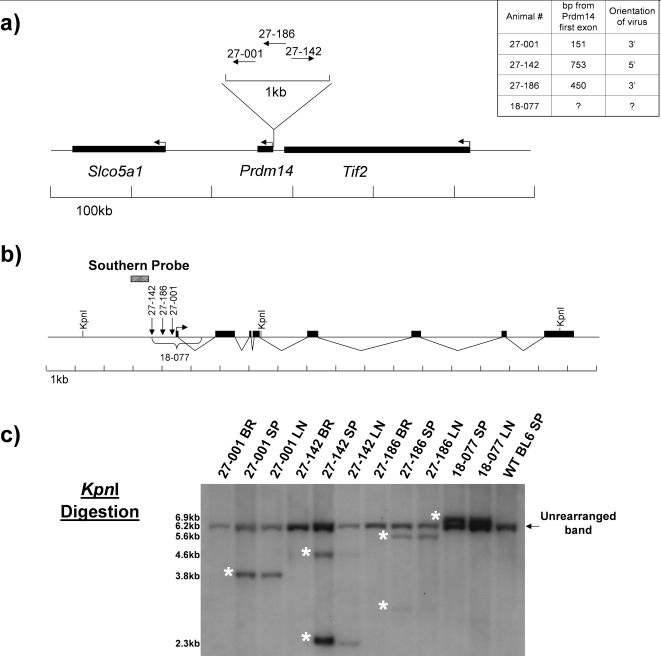
Figure 1. Evi32 Viral Insertion Sites.
1a) The genomic locus surrounding Evi32 insertions. Locations of proviral insertions were determined by either VISA PCR or by PCR after identification of Evi32 integrations. Arrows indicate direction of transcription and the orientation of the retroviral integration. The exact orientation and location of the retroviral integration in animal 18-077 was not determined, but it is contained between the HindIII and XbaI digestion sites as determined by Southern blot analysis. Table at top right indicates the distance of each retrovirus from the first exon of Prdm14. 1b) Closeup view of Evi32 integrations. Restriction enzymes indicated were those used in digestion of tumor DNA to show genomic rearrangements at Evi32. Arrow indicates direction of transcription of Prdm14, and the black boxes show the eight exons of Prdm14. Prdm14 gene structure is based on VEGA prediction (OTTMUSG00000017097) obtained from the Ensembl database. RT-PCR amplification indicates that the VEGA prediction is a true Prdm14 transcript. 1c) Southern blots showing retroviral integrations at Evi32. Genomic DNA from indicated tumors was digested with KpnI. Brain serves as somatic tissue control from same animal to show rearrangement of Evi32 locus within the tumor tissue only. Rearranged bands seen in Evi32 tumors are indicated by asterisks and show genomic rearrangements at Evi32. BR = Brain, SP = Spleen, LN = Lymph Node.

