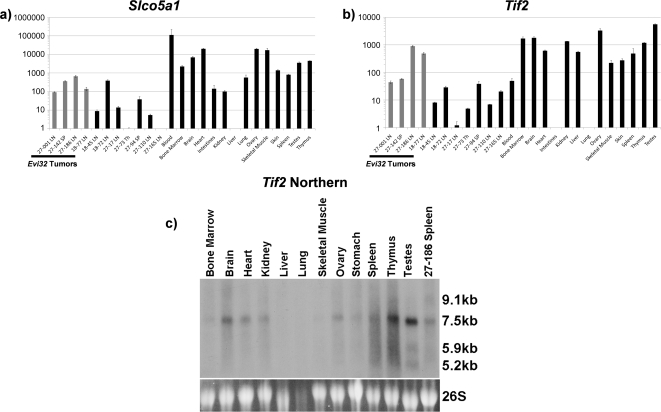
Figure 2. Tif2 and Slco5a1 are not misexpressed in Evi32 tumors.
2a) Q RT-PCR was performed on cDNA prepared from total RNA samples from tumors with and without insertions at Evi32 and control tissue obtained from 8 week old C57BL/6J mice. Expression of Slco5a1 was normalized to 18S expression levels and then quantified. We found that the expression of Slco5a1 does not appear to be consistently altered with Evi32 proviral insertions and is expressed at lower levels than seen in normal spleen, thymus, and bone marrow. Expression levels are shown on a log scale to show lower levels of expression. 2b) Expression of Tif2 was quantified in the same manner as Slco5a1. This analysis revealed that Tif2 is expressed at similar or lower levels than normal spleen, thymus, or bone marrow in all Evi32 tumors. Expression levels are shown on a log scale to show lower levels of expression. 2c) Northern blot analysis of Tif2 was performed using total RNA obtained from Evi32 tumor 27-186 and control tissue obtained from 8 week old C57BL/6J mice. The probe to Tif2 was directed towards common exons found in all isoforms. Sizes were estimated using 18S and 26S migration distances. The 27-186 Evi32 tumor showed the greatest expression of Tif2 as determined by Q RT-PCR, but shows no increase in expression by northern analysis. SP = Spleen, LN = Lymph Node, Th = Thymus.

