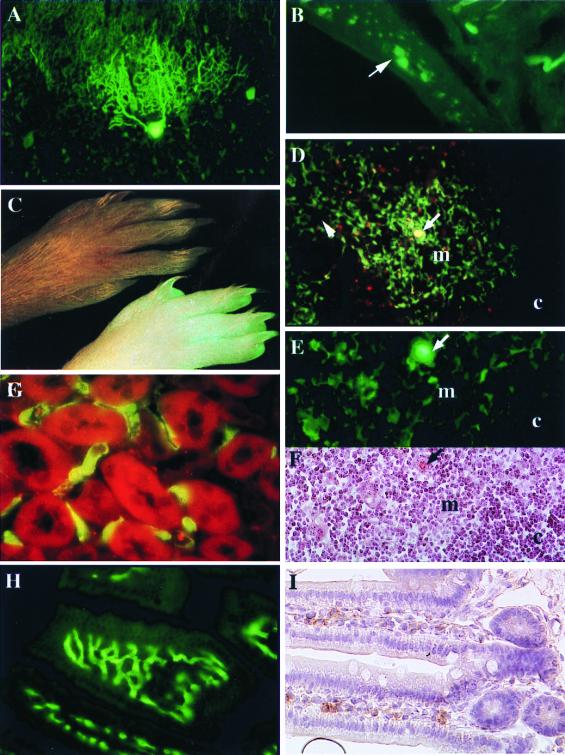
Figure 4.
Analysis of reporter gene expression in PrP-gfp tg mice (L64). (A) Coronal section of cerebellar cortex in which the transgene is expressed in Purkinje neurons. (×200.) (B) Section of the wall of the small intestine showing fluorescence in the ganglion cells in the enteric nervous system. (×200.) (C) Fluorescence picture of the foot from the gfp tg mice (Lower) and their littermate controls (Upper). (D and E) Sections of thymus showing fluorescence in the epithelial cells of the medulla (m) around the Hassal's corpuscles (arrow). c, cortex. [×40 (D) and ×200 (E).] (F) Thymus section stained with eosin and hematoxylin. E and F are serial sections. (G) Sections of renal cortex showing fluorescence in the endothelial cells of the capillaries around the tubules. (×200.) (H and I) Sections of small intestine of gfp-tg mice (H) and wild-type mice stained with anti-PrP 8G8 antibody (1:200) (I). (×200.)

