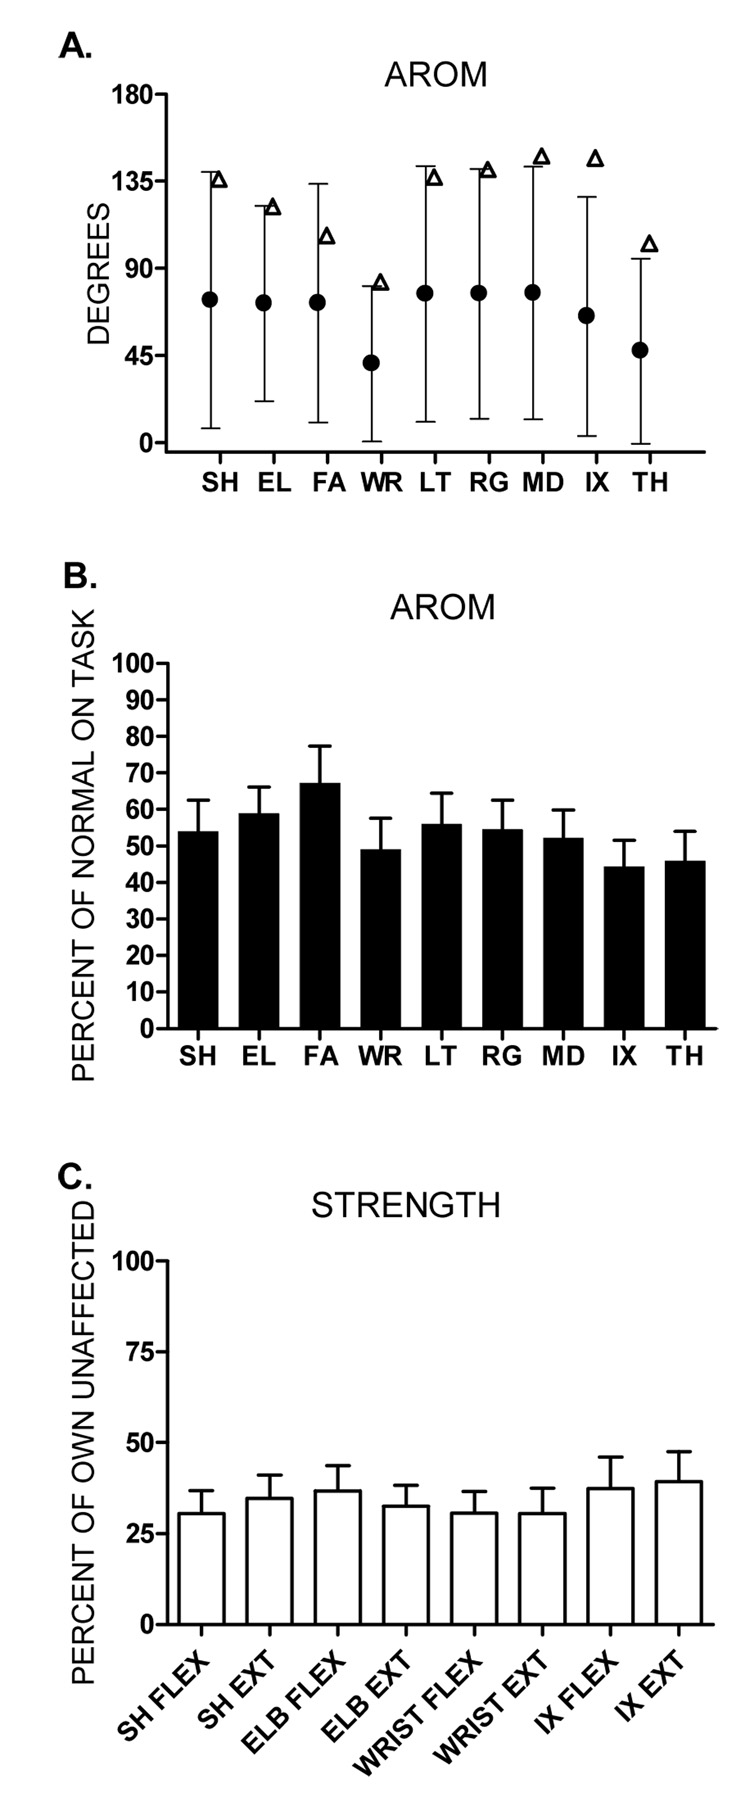
Figure 1.
A: Group means ± SDs for affected side AROM (●) values for each of the 9 segments. (Δ) represents normal AROM for each of the 9 segments. Normal AROM values were obtained from the unaffected side of comparable aged individuals with stroke performing the same task (Figure 5A, Lang & Beebe, 2007) and are shown only to appreciate how the percent of normal AROM was calculated. B: Bars represent mean percent of normal AROM ± SEs. C. Group means ± SEs for the percentage of affected to unaffected side strength. SH: shoulder, EL: elbow, FA: forearm, WR: wrist, LT: little finger, RG: ring finger, MD: middle finger, IX: index finger, TH: thumb, FLEX: flexion, EXT: extension

