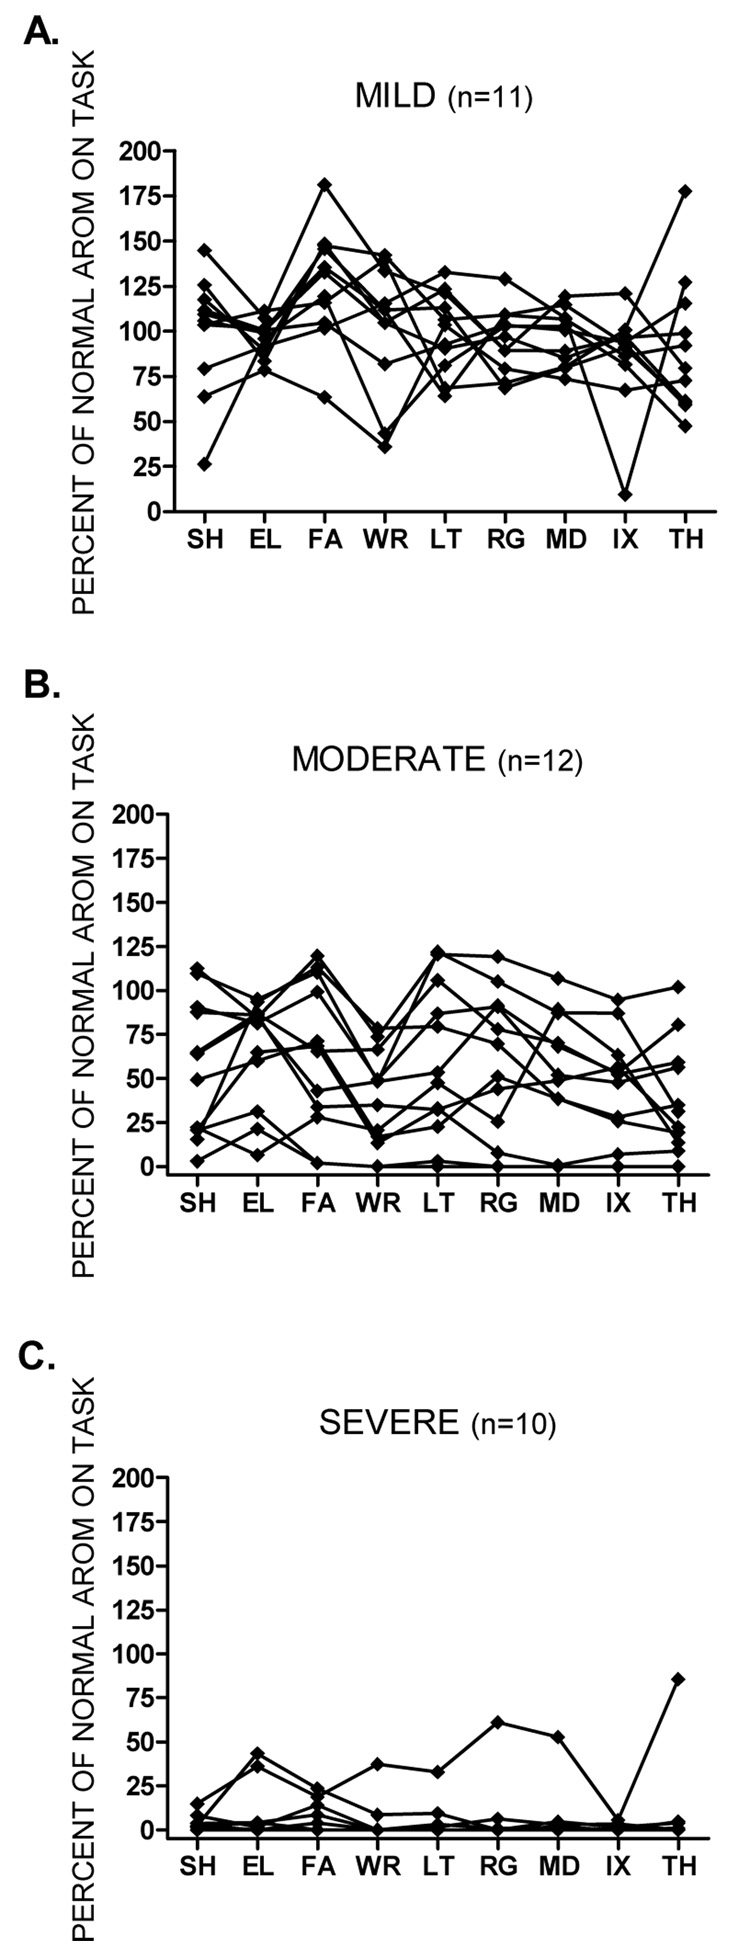
Figure 2.
Figures A, B, and C show individual data for percent of normal AROM at each segment of the upper extremity. Values may be greater than 100% if a subject moved a particular segment much more than the average of the healthy sample. Subjects were stratified according to the percent strength in their unaffected arm. Figure A: mild ≥ 50% strength of unaffected side. Figure B: moderate < 50% strength of unaffected side. Figure C: severe = 0% strength of unaffected side. It is possible to have 0% strength, but still have some AROM because a person was given a score of 0 at a segment if they were unable to hold the test position against gravity. If distal segments were affected to a greater degree than proximal segments, we would have expected to see lines sloping downward from left to right. Abbreviations same as in figure 1.

