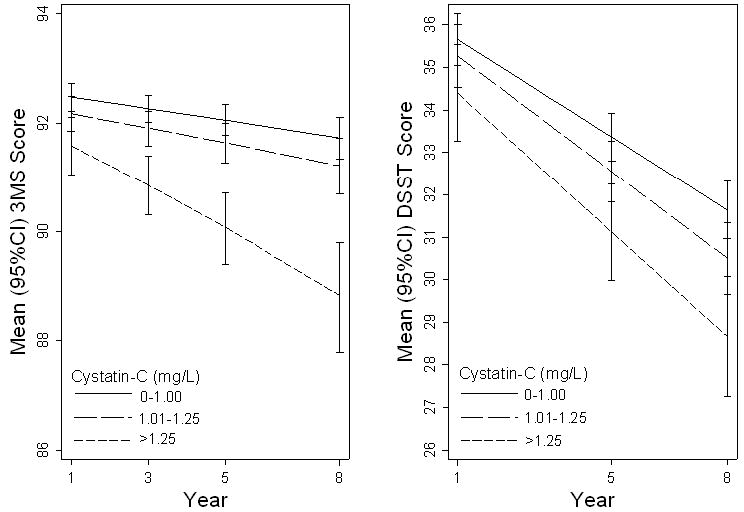
Figure 1.

Mixed model predicted 3MS and DSST score as a function of cystatin-C level, adjusted for age, race, gender, education, baseline cognitive score, body mass index, C-reactive protein, hypertension, diabetes, and stroke. Error bars indicate 95% confidence intervals.
