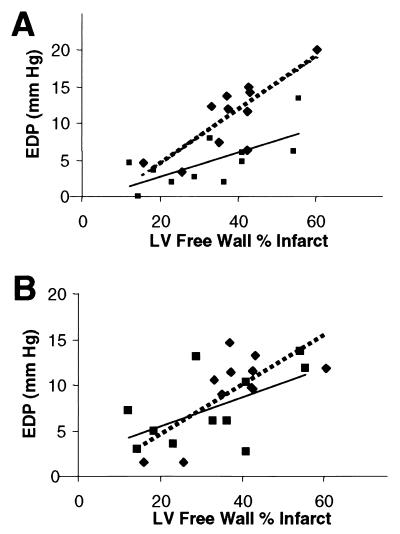
Figure 4.
Baseline EDP is plotted vs. infarct size for EV (n = 11; diamonds, dotted line) and Adeno-βARKct-treated (n = 11; squares, solid line) rabbits. (A) At day 10, the equations for the regression lines are y = 0.3617x −2.725, r = 0.81 for EV, and y = 0.1663x −0.6297, r = 0.68 for Adeno-βARKct; P < 0.005 for overall coincidence, indicating that the lines are significantly different. (B) At day 20, y = 0.1580x + 2.333, r = 0.57 for EV and y = 0.2719x −0.7664, r = 0.72 for Adeno-βARKct, and the lines are not significantly different (P = 0.50).

