Figure 1.
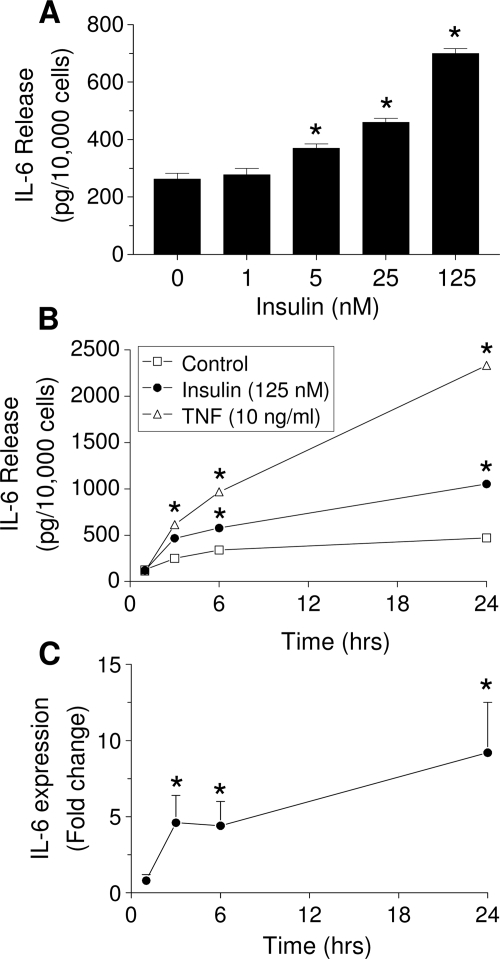
Time- and dose-dependent effect of insulin on IL-6 release and gene expression in undifferentiated LS14 human adipocytes. A, Cells were treated with insulin for 6 h. B, Cells were incubated with 125 nm insulin (black circles) or 10 ng/ml TNFα (white triangles) for different times. IL-6 in CM was measured by ELISA. C, Cells were incubated with 125 nm insulin, and IL-6 mRNA levels were determined by real-time PCR. Values in A and B are the mean ± sem of four determinations, and are representative of three separate experiments. IL-6 gene expression was calculated as the fold change over controls and represents three separate experiments. *, Significant differences (P < 0.05) from control.

