Figure 3.
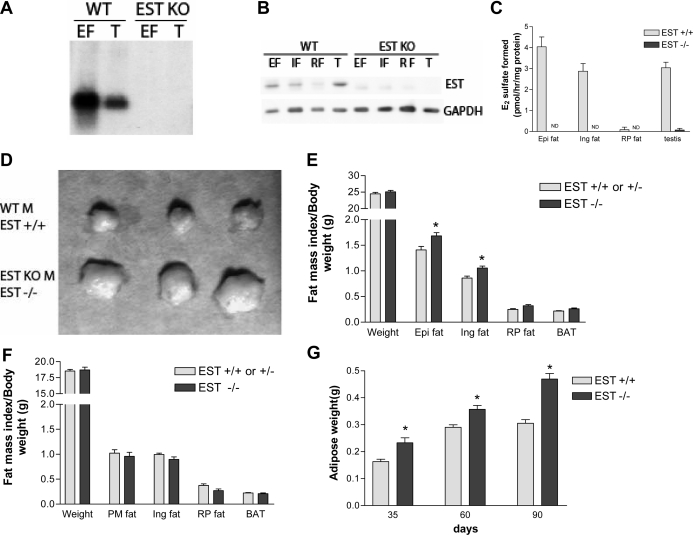
Increased adipogenesis in male EST-deficient mice. A, Northern blot analysis of EST expression in epididymal fat (EF) and testis (T) from WT and EST−/− male mice. B, Western blot analysis of EST expression in epididymal (EF), inguinal (IF), retroperitoneal (RF) fat, and testis of WT and EST−/− male mice. C, EST enzyme activity assay of various fat depots and testis of WT and EST−/− male mice. D, Representative epididymal fat masses collected from three WT and EST−/− male mice. KO, Knockout; M, male. E, Body weights and fat mass indices of 10-wk-old male EST WT/heterozygous (n = 23) and EST−/− mice (n = 16). Fat mass index = adipose weight/body weight × 100. Epi, Epididymal; Ing, inguinal; RP, retroperitoneal. F, Body weights and fat mass indices of 10-wk-old female EST WT/heterozygous (n = 18) and EST−/− mice (n = 7). PM, Parametrial. G, Increased epididymal fat mass in EST−/− mice was observed at all three ages examined (n = 8–12 for each group). Data presented are mean ± sem. *, P ≤ 0.05, Student’s t test.

