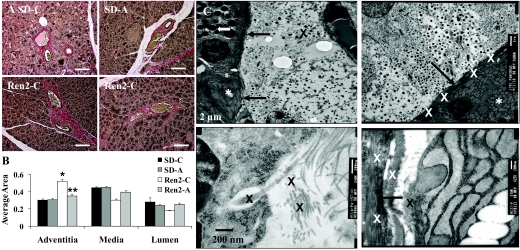
Figure 7.
A, Perivascular fibrosis in the Ren2 pancreas. Representative images of light microscopy of structural changes consistent with perivascular fibrosis using VVG staining. B, Graph depicting the percent areas of perivascular fibrosis in the Ren2. *, P < 0.05 when compared with SD-C; **, P < 0.05 when Ren2-A is compared with Ren2-C. C, Ultrastructural evaluation of IEI fibrosis within the pancreas using TEM. Top left panel depicts the normal appearance of the IEI (black arrows) between the endocrine islet and exocrine region of the pancreas in the SD control. Box arrow (white) indicates zymogen granules in the exocrine pancreas compared with the much smaller (electron dense) islet secretory granules (X). Magnification, ×10,000. Scale bar, 2 μm. Top right panel demonstrates the IEI region (open arrow) is somewhat expanded in the Ren2-C compared with the higher magnification of ×10,000 in the SD-C. The areas of early fibrosis (black arrow) are even more evident at higher magnification in bottom right panel. In addition to early fibrotic changes, the Ren2-C demonstrates ER compacting in the exocrine pancreas (white star). Magnification, ×6000. Scale bar, 1 μm. Bottom left panel demonstrates disordered collagen fibrils (X) in close association with IEI and increased rER (rough endoplasmic reticulum). Magnification, ×25,000. Scale bar, 200 nm. Bottom right panel displays both orderly longitudinal and cross-section fibrillar-banded collagen (white X) in the Ren2 control. The arrow depicts the IEI region between the endocrine and exocrine pancreas not found in the SD-C. Note the liberation of zymogen granule contents (black X) into the IEI region. Magnification, ×25,000. Scale bar, 200 nm.

