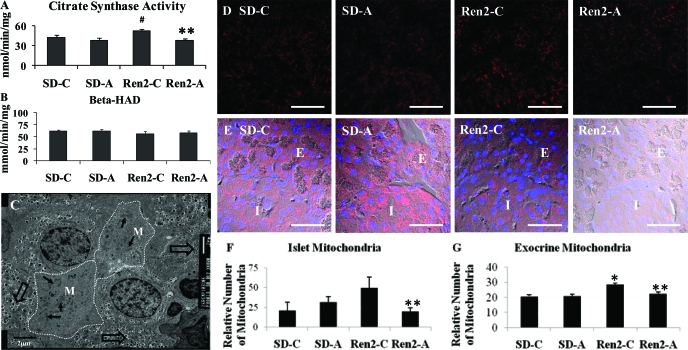
Figure 8.
Pancreas mitochondria in the Ren2. A, Citrate synthase activity as a marker for mitochondrial content in pancreas tissue. B, β-HAD activity, a marker for fatty acid oxidation and mitochondrial source of oxidative stress in the pancreas. C, Representative image of the Ren2-C β-cells within the center of the islet on TEM. Note the increased aggregation and clumping of the mitochondrial network within the β-cells (arrows, surrounded by dashed white lines). Also note the lack of insulin secretory granules (open arrows) in these areas of increased mitochondria. This type of image is prevalent within the islets of the Ren2 model and were not noted within the islets of the SD control model. Magnification, ×4000. Scale bar, 2 μm. D, Representative fluorescent images of pancreas incubated with anticomplex IV subunit 1. E, Fluorescent images from C were merged with the transmitted images showing the islet structure I, Islet; E, exocrine tissue. Quantification of relative number of mitochondria in both islet (F) and exocrine pancreas (G). *, P < 0.05 compared with SD-C; #, P = 0.06 when compared with SD-C; **, P < 0.05 when Ren2-A is compared with Ren2-C. Scale bar, 50 μm.

