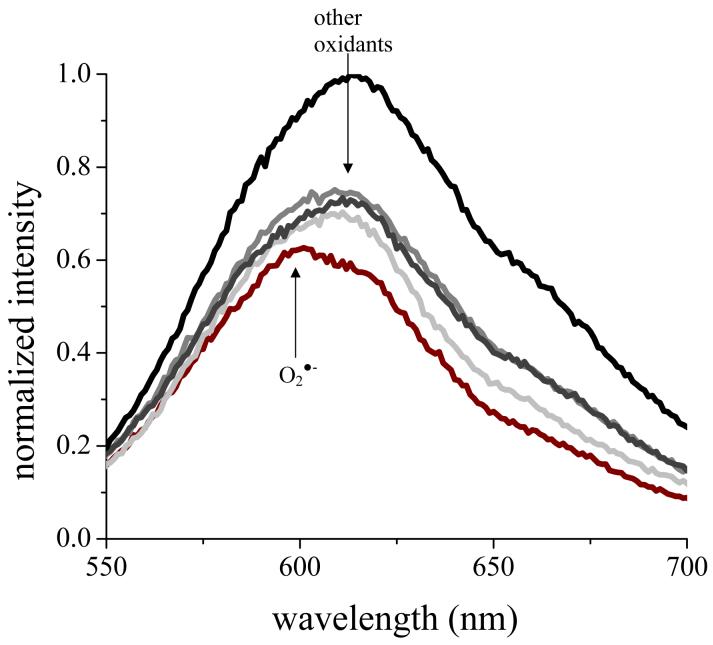
Figure 6.
O2·- detection by HE in LPS/IFγ-activated TIB-7 cells. Fluorescence spectra had an λex = 510 nm at 0.5 h (crimson), 1.5 h (light gray), 2.5 h (gray), 10 h (dark gray) and 20 h (black) after addition of 50 μM HE to ∼1×10⁶ RAW macrophages at the indicated times. The arrows indicated the fluorescence spectral maxima observed in control studies using O2·- (595 nm) or the other oxidants (615 nm).

