Figure 6.

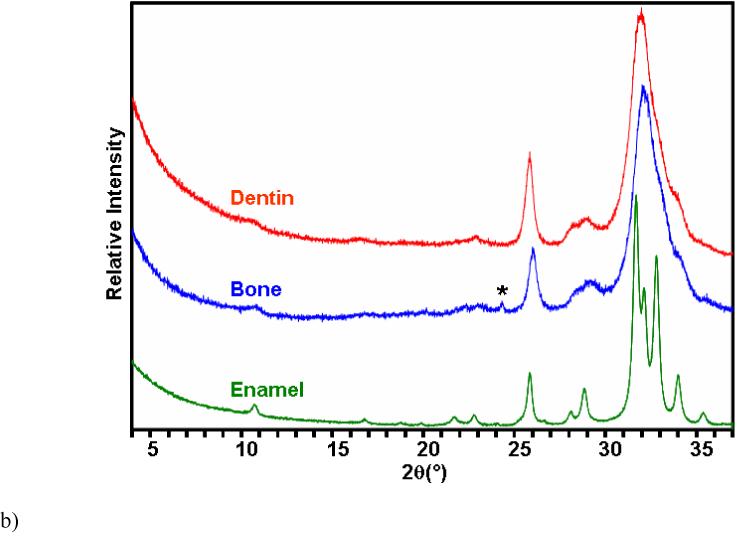
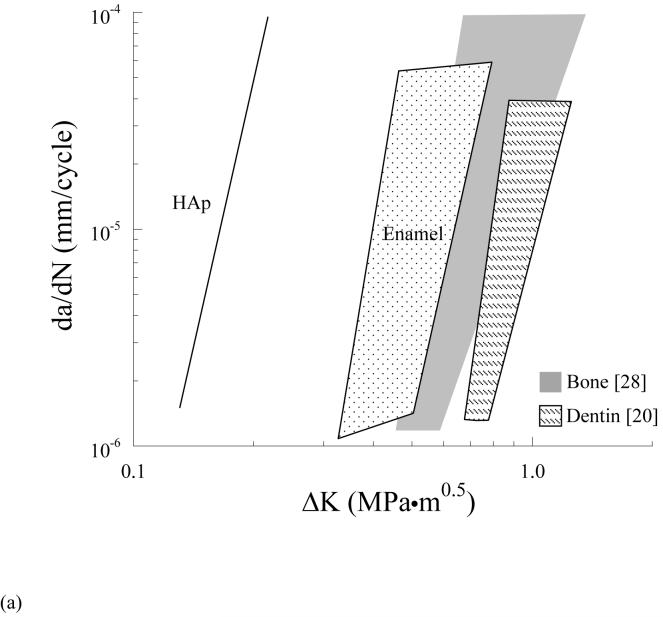
Comparison of fatigue crack growth response and chemistry of enamel with bone and dentin.
(a) the data in Figure 3 are compared with results from fatigue crack growth in human dentin [20] (R=0.1, frequency 5 Hz) and human cortical bone [28] (R=0.1, frequency 1 Hz)
b) XRD patterns of enamel, bovine bone and dentin. * This small reflection comes from the aluminum holder

