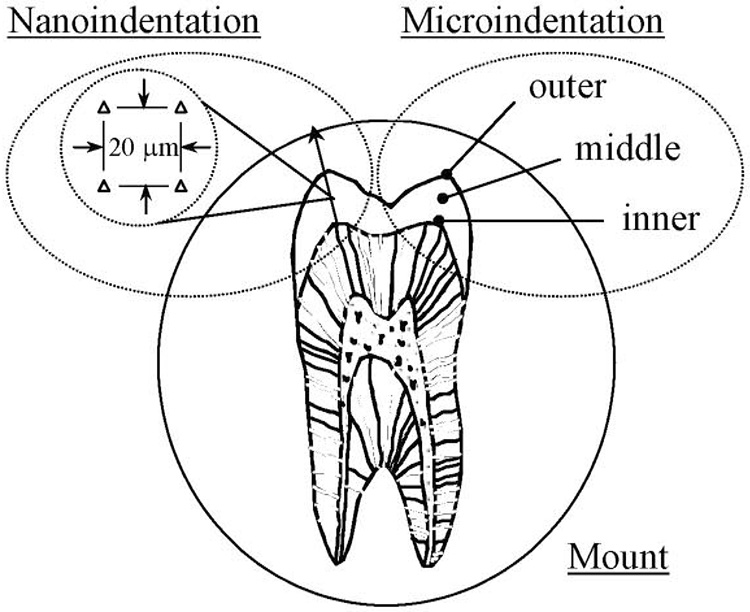
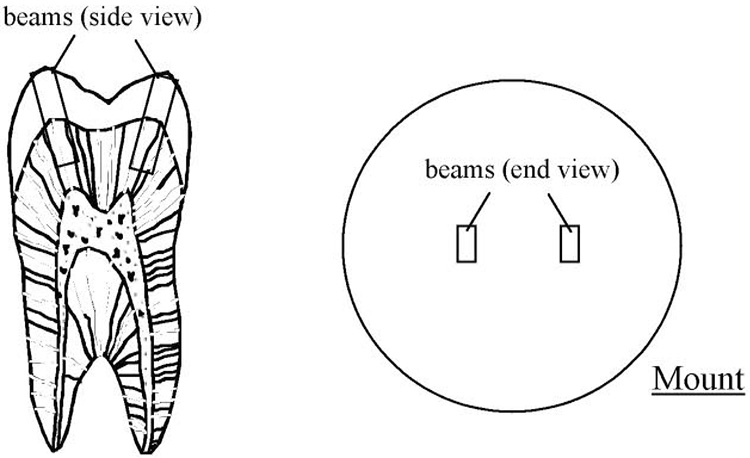
Figure 1. Schematic diagrams of the specimen configurations and regions of evaluation.
a) a molar sectioned bucco-lingually and the regions of evaluation for the nanoindentation and microindentation testing. Nanoindentation was performed along paths defined parallel to the prism orientation in the cuspal region as defined by the line with arrow (left side). Indentations were made from the DEJ to the occlusal surface at 9 equidistant sites along this line.
Microindentation was performed in the inner, middle and outer enamel to evaluate indentation load dependence on the hardness (right side).
b) specimens used for estimating the apparent fracture toughness using the microindentation approach. The cuspal beams were mounted in cold-cure epoxy such that the occlusal surface faced outward and the enamel prisms were oriented perpendicular to the potting surface.


