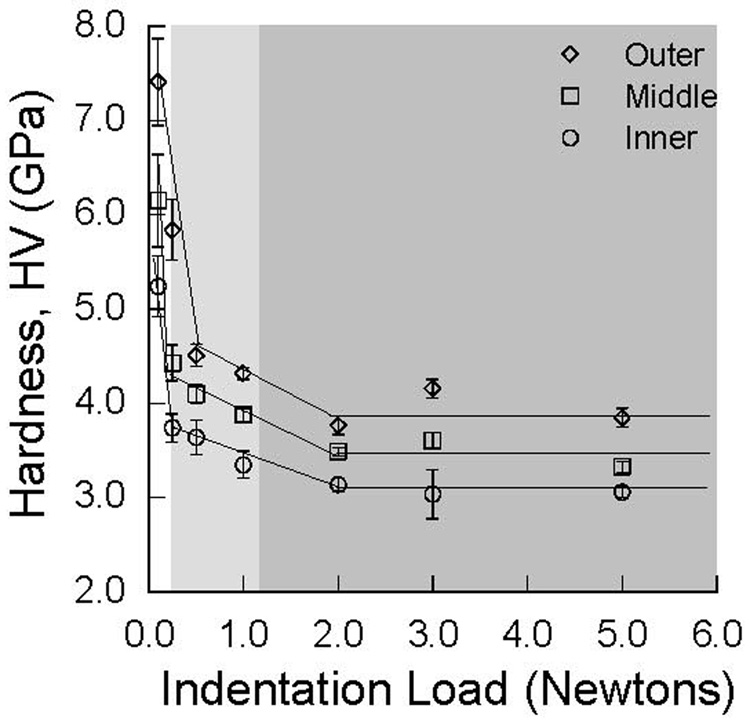
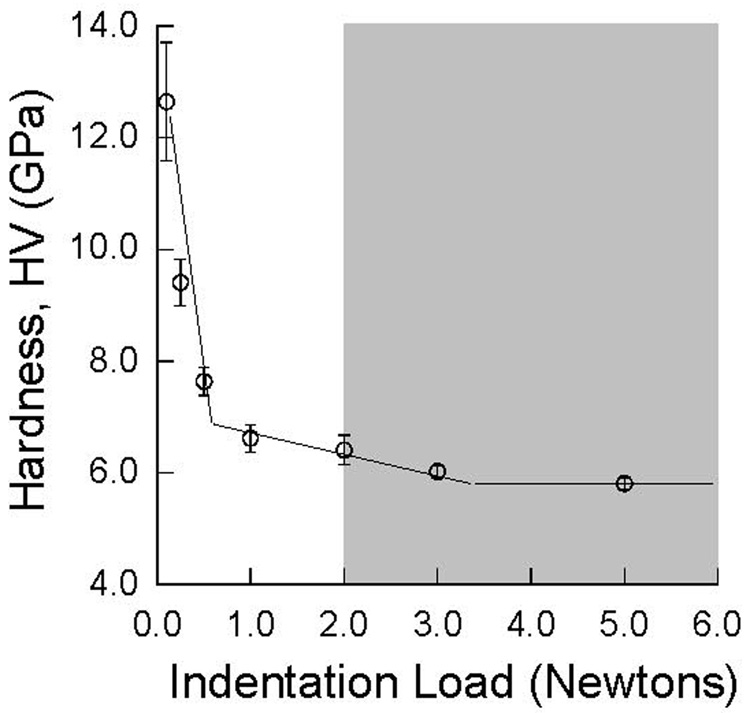
Figure 4. Indentation size effect diagrams for enamel and a selected crown material.
a) human enamel (patient age = 23). The highlighted region indicates the load range in which microcracks (light grey) were evident at the indentation periphery and well-defined cracks (grey) were evident at the indentation corners.
b) porcelain veneer on an alumina foundation. The highlighted region indicates the load range in which well-defined cracks were evident at the indentation corners. There was no evidence of microcracking at smaller loads.


