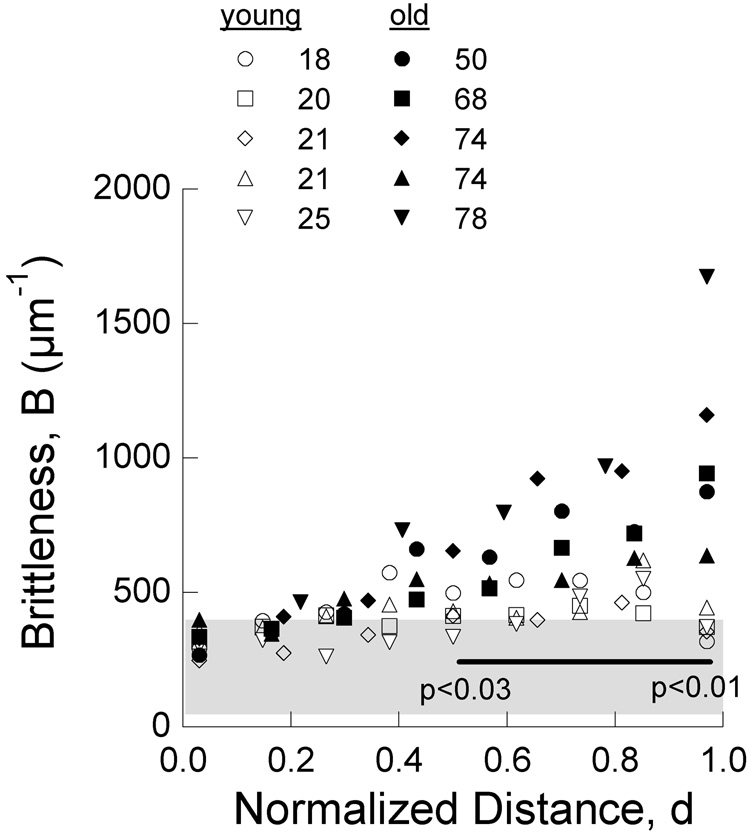
Figure 6. Brittleness distribution for the young and old enamel.
The brittleness numbers in this figure were calculated according to Eqn. 1 using the H and E distributions obtained using nanoindentation (Fig. 3) and the Kc(app) distribution obtained using microindentation (Fig. 5). The region highlighted in gray represents the range in brittleness numbers obtained for the dental materials listed in Table 1. *The line denotes significant difference over the range in normalized distance covered. The p-value increases from left to right.

