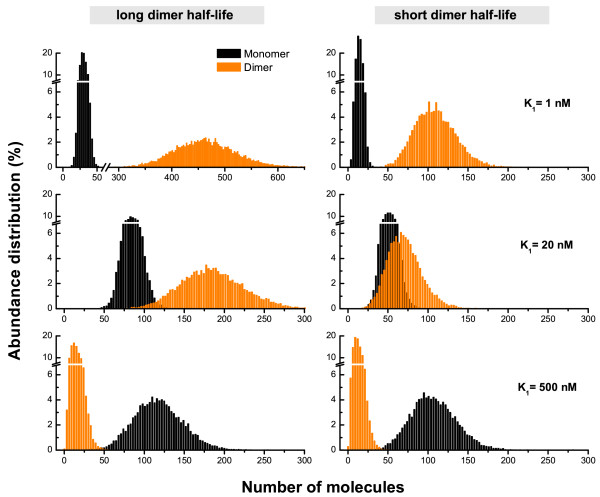
Figure 3.
Stationary state distribution of monomer (black) and dimer (orange) protein abundance in the positive autogenous circuits. The left (right) column corresponds to a ratio of the dimer and monomer decay rates of γ2/γ1 = 1/10 (γ2/γ1 = 1/2). The molecular copy numbers are collected at a fixed time interval (5·103 sec) after the steady state has been reached. Here K1 ≡ q1/k1 is the dissociation constant of the protein dimer. As the binding equilibrium is shifted towards the dimer state (decreasing K1), the noise level is monotonically reduced (see Table 2). Note that the prolonged protein lifetime due to the complex formation (left column) affects the noise level.

