
Fig. 5.
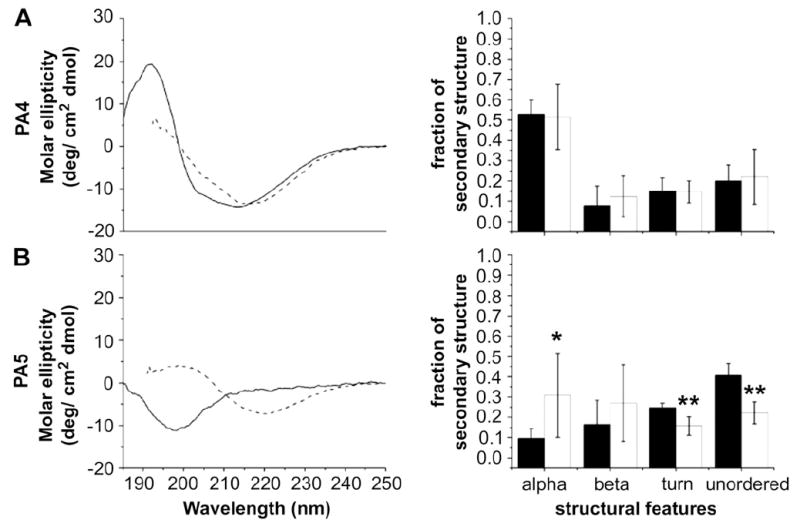
CD spectra and quantified secondary structure for RGD-bearing PAs. PA4 shows similar secondary structure characteristics before and after the addition of calcium chloride (indicated by solid lines/black bars and dotted lines/white bars, respectively). PA5 shows a significant random coil component prior to calcium chloride addition that disappears afterward. In the bar graph quantifying the percentage of each secondary structure type, error bars denote standard deviation; a single asterisk (*) denotes that the percentage of that structure type post-salt addition is significantly different from the original percentage to a 95% confidence interval; a double asterisk (**) denotes a difference to the 99% confidence interval. The amount of three out of four components changes significantly.