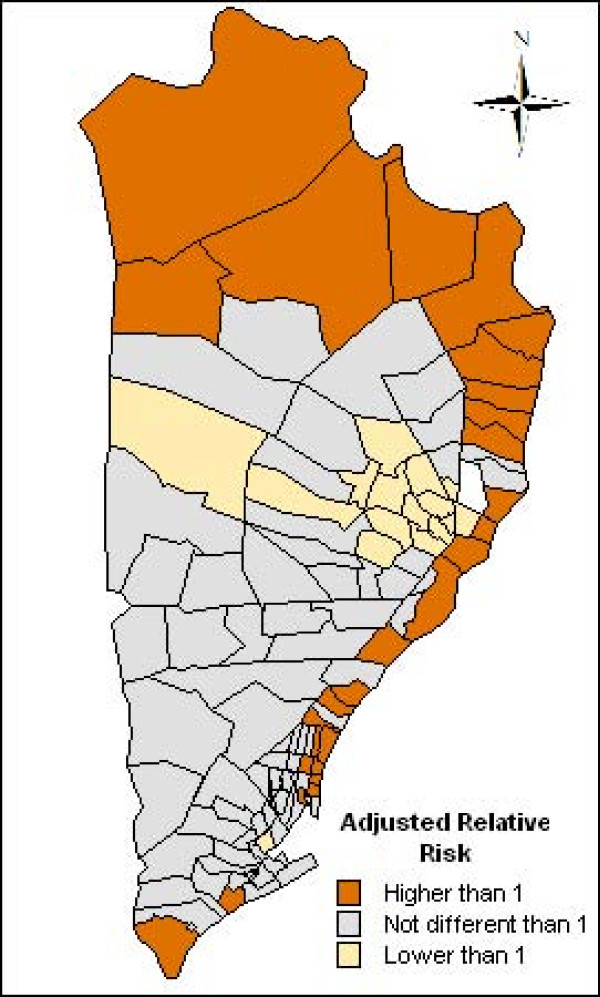
Figure 7.
Posterior probability of the neighbourhood-specific adjusted relative risk to be different than one estimated by the spatial model. Orange colour: adjusted relative risk higher than one, grey colour: adjusted relative risk not different than one and yellow: adjusted relative risk lower than one.

