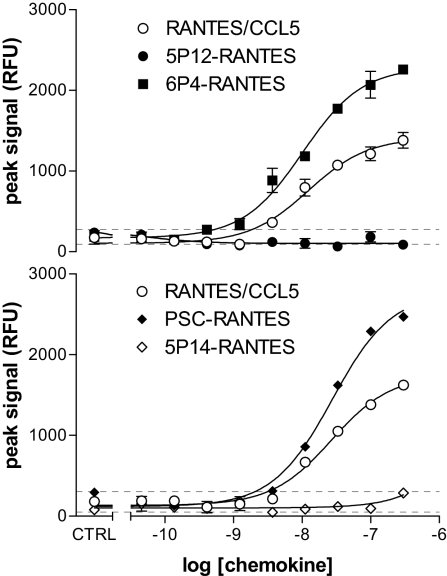
Fig. 3.
Signaling activity of native RANTES and RANTES analogs on CCR5-expressing primary cells. Calcium flux measurements were carried out as described in Methods. Determinations in each of the 2 series shown were in duplicate; error bars indicate minimum and maximum values. Dotted lines indicate limits (min, max) for the negative controls (no chemokine).

