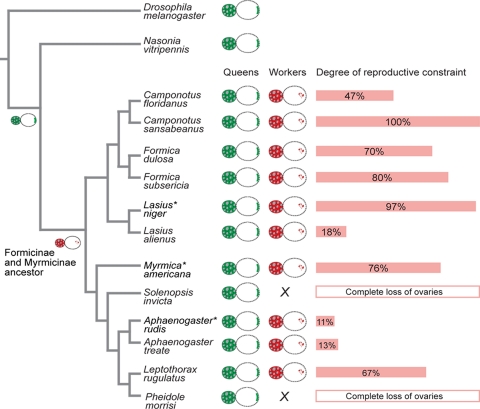
Fig. 4.
The evolutionary dynamic of reproductive constraint in ants. Phylogenetic relationships were based on ref. 36. The asterisks indicate the three focal species. The unconstrained reproduction of solitary insects and ant queens is represented by a green oocyte diagram showing proper localization of maternal determinants. The constrained reproduction in the workers of several ant species within the formicines and myrmicines is represented by a red oocyte diagram showing impaired maternal determinant localization. The oocyte diagram at particular nodes represents the likely state of the ancestor of formicines and myrmicines, and of hymenopterans. The length of the red bars reflects the level and percentage of constraint, which was calculated as the number of failed oocytes divided by the total number of failed and viable oocytes produced by orphaned workers. Trophic oocytes were excluded.

