Fig. 4.
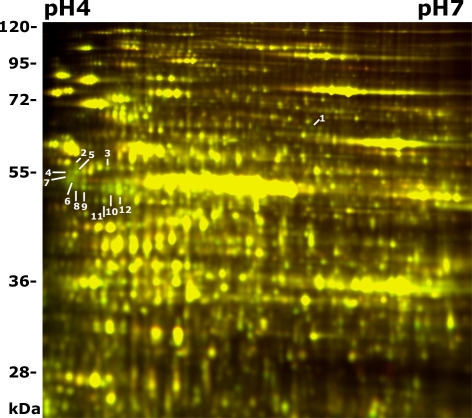
2-D DIGE analysis of pfd6–1. Proteins from pfd6–1 and wild-type seedlings grown in liquid growth medium were extracted and labeled with DIGE Cy5 (red) or Cy3 (green), respectively. Proteins were then separated on pH 3–10 nonlinear IPG strips, followed by SDS/PAGE (12.5%) and scanning for Cy5 or Cy3 fluorescence. Color overlay of 2D-DIGE images (pH 4–7 range) of the control (Col-0) and pfd6–1 was shown. Proteins decreased in pfd6–1 display green, and those increased display red, whereas those unaffected display yellow. Protein spots of interest are marked with spot numbers and their identities are shown in Table 2.

