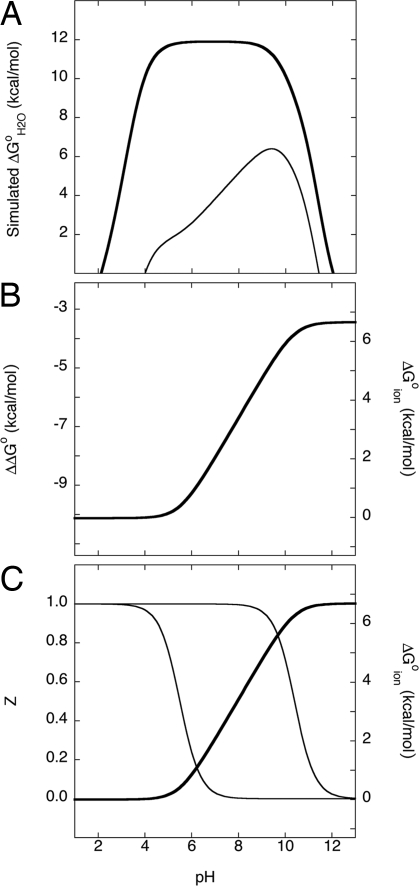
Fig. 1.
Thermodynamic linkage between pH dependence of stability and shifts in pKa values. (A) Simulated pH dependence of stability (ΔG°H2O) of a protein (thick line) and of one of its variants with an internal Lys with a pKa value of 6 (thin line). (B) Difference in the thermodynamic stability curves (ΔΔG°H2O) in A. (C) H+ titration curves (thin lines) of a Lys with a normal pKa value of 10.4 and with a pKa value of 6.0. The area between these two titration curves (dark line) is equivalent to ΔΔG°H2O in B.

