Fig. 3.
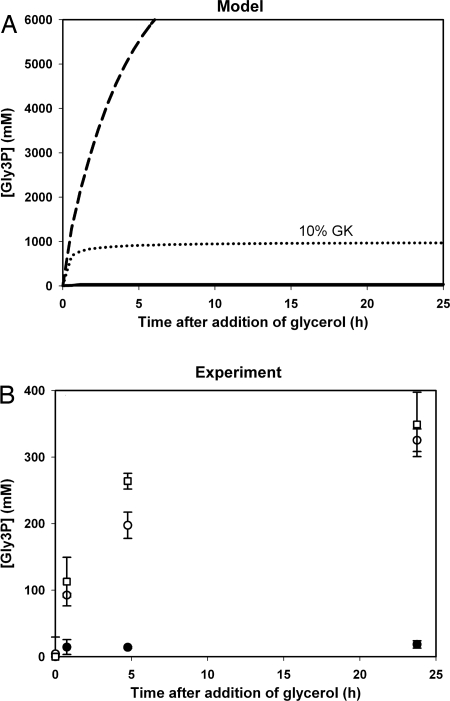
Gly3P profiles upon addition of glycerol. Model versus experiment. Glycerol (25 mM) was added at t = 0 in the model and in experiments. (A) The concentration of Gly3P was calculated in time in a model with (solid line) and without (dashed line) a glycosome. The dotted lines show results from a time simulation in the model without the glycosome and with only 10% of the usual cellular GK activity. (B) The measured intracellular Gly3P concentration in cells induced or not induced for PEX14 RNAi. Open symbols, Tet-induced cultures; filled symbols, uninduced cultures. Squares and circles show independent biological replicates. Error bars represent standard deviations of 2 measurements of the same sample.

