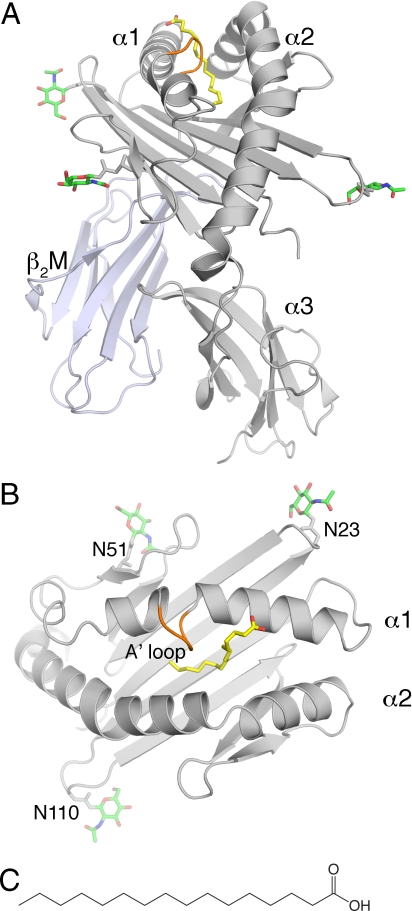
Fig. 1.
Overview of the chCD1–2 structure with bound palmitic acid. (A) Front view of chCD1–2 (α1, α2, and α3 in gray and β2M in blue-gray) with palmitic acid in yellow. The A′ loop extends from the α1 helix in orange. (B) Top view, looking down into the chCD1–2-binding groove. N-linked carbohydrates are shown as green sticks emanating from 3 Asn positions (N23, N51, and N110), with nitrogen and oxygen colored in blue and red, respectively. (C) Chemical representation of palmitic acid.

