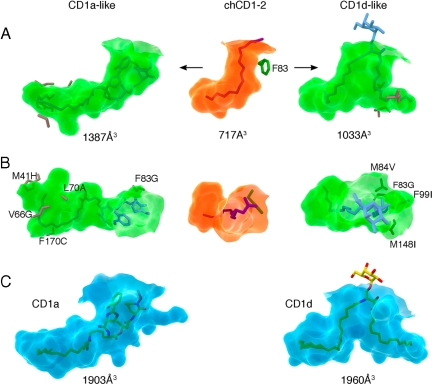
Fig. 5.
In silico evolution of chCD1–2 to a mammalian-type binding groove. (A) Side view: the semitransparent molecular surface of the chCD1–2-binding groove is shown in the center (green). The predicted shapes and sizes of the binding grooves resulting from the indicated mutations are shown to the left (CD1a-like) and right (CD1d-like). (B) Top view (TCR-view) of the binding groove shown in A. The lipopeptide ligand of CD1a fits well into the mutated chCD1a-like groove, and a truncated form of α-GalCer is modeled into the CD1d-like chCD1–2 groove (blue sticks in A and B). (C) Transparent molecular surfaces (blue) of hCD1a with bound lipopeptide (yellow sticks, left panel) and hCD1d with bound α-GalCer (right panel) for comparison. Groove volumes were calculated using the CASTp server (53).

