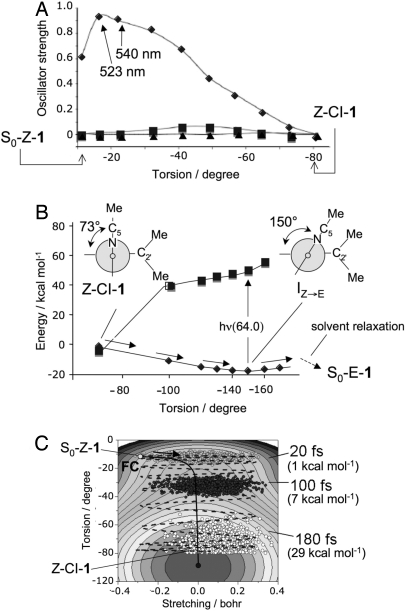
Fig. 2.
Analysis of the Z → E photochemical reaction path. (A) Change in CASSCF/6–31G*/AMBER S0 → S1 (diamonds), S0 → S2 (triangles), and S0 → S3 (squares) oscillator strengths. (B) CASPT2//CASSCF/6–31G*/AMBER S0 (diamonds), S1 (squares) energy profiles along the Z → E S0 relaxation path computed with a fixed solvent shell and starting at Z–CI–1. (C) Simulation of the population dynamics along a 2D-model of the S1 energy surface. The arrow indicates the initial direction of the gradient. The values in parentheses refer to the kinetic-energy component along the torsion (i.e., isomerization) mode.

