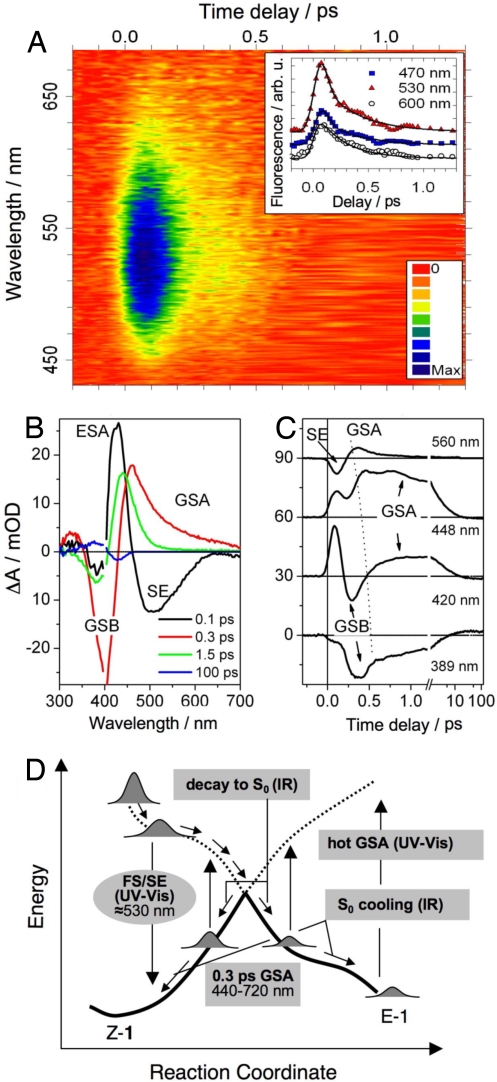
Fig. 3.
Ultrafast UV-vis spectroscopy. (A) Time- and wavelength-resolved fluorescence of Z-1 with color-scale-coded intensity. The maximum at 520–530 nm and a biphasic decay are apparent. (Inset) Kinetic traces at selected wavelengths (data points are vertically shifted for the sake of clarity). Solid lines are best-fits to the data. (B) Time-resolved absorption spectra (change in absorbance, ΔA), showing S1 → Sn absorption (ESA, 425 and 330 nm), S1 → S0 stimulated emission (SE, 460–700 nm) and the S0 absorption (GSA, 440–700 nm), blue-shifting at later times (420–480 nm). The 100-ps data are the E-Z difference spectrum. Data points with residual pump light scatter (395–405 nm) are removed. (C) Selected kinetic traces, vertically shifted by 30 mOD. The dashed line is a guide to the eye highlighting the blue-shifting early GSA feature (D) Schematic view of the observed spectral transitions on the S0 (solid lines) and S1 (dashed lines) potential-energy surfaces as a function of the (Z → E) reaction coordinate. Arrows indicate the course of the reaction as suggested by the observed sequence ESA/FS/SE → GSA → hot-GSA. GSA and hot-GSA arise, most probably, from both Z and E conformers. The phases of the photoreaction probed by time-resolved IR spectroscopy are also indicated.

