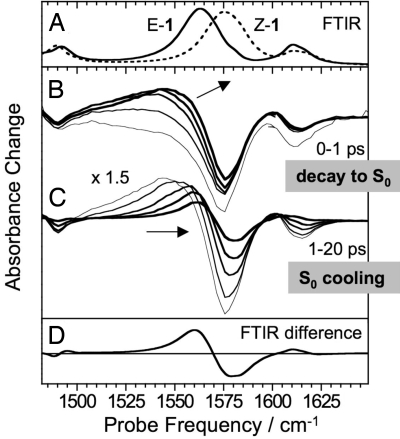
Fig. 4.
Time-resolved mid-IR spectra. (A) FTIR absorption spectra of Z-1 (dashed line) and E-1 (solid line). (B) Transient spectra at different delays (0, 0.2, 0.4, 0.6, and 1 ps) after the excitation of Z-1 at 420 nm. (C) Transient spectra at delays 1, 2, 5, 10, and 20 ps, all scaled by a factor of 1.5 for better visibility. (D) Difference between the FTIR spectra shown in A reproducing the transient spectra at delays >30 ps.

