
Figure 5.
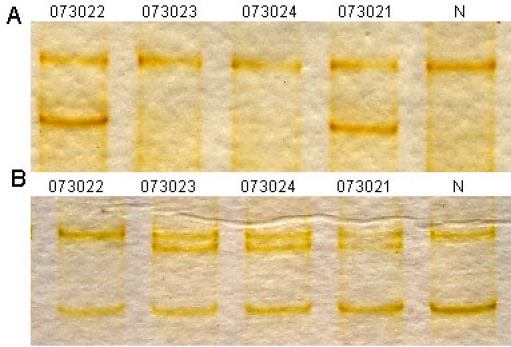
Single strand conformation polymorphism analysis for the two mutations identified in the current study. A: Single strand conformation polymorphism (SSCP) analysis for the heterozygous mutation c. 8559–2A>G revealed that the mutant pattern (two bands) cosegregated with the affected individuals and carriers, but not with the unaffected individuals and normal control (one band). B: SSCP analysis for c.11806A>C (p.T3936P) showed that the mutant pattern (three bands) cosegregated with the affected individuals and carriers, but not with the unaffected individuals and normal control (two bands). Participant identification number is listed above each lane. N represents the normal control.