
Figure 2.
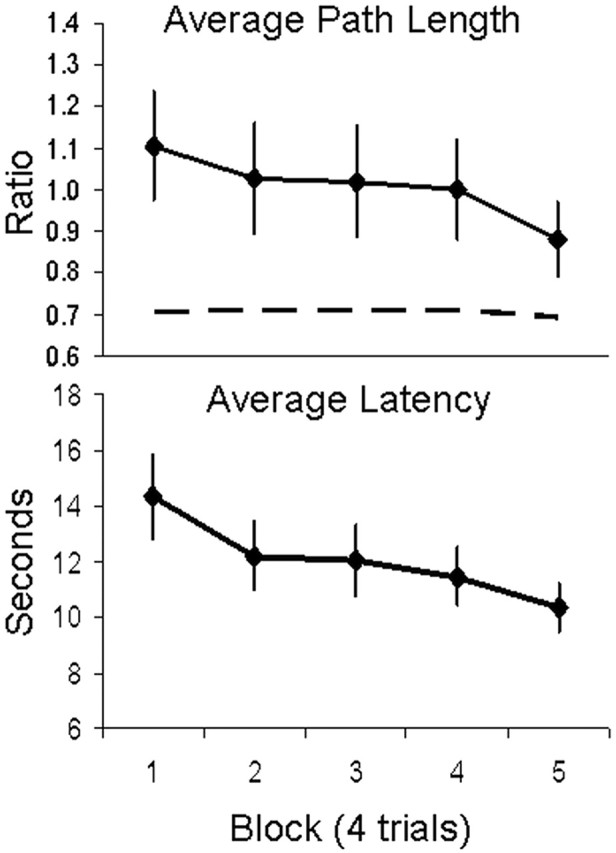
Spatial learning curves during MEG data acquisition. Navigation performance is quantified by path length taken from the starting position to the hidden platform (top) and total latency to reach the platform over five blocks of four trials (bottom). Path length is expressed relative to the diameter of the pool. The dashed line represents the ideal path length relative to the diameter of the pool, namely, a straight line from the various starting positions to the platform. Error bars represent SEMs.