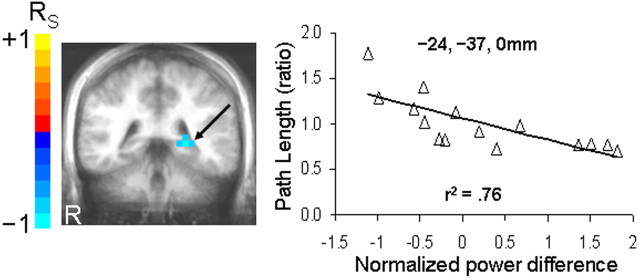
Figure 5.
Linear relationship between theta activity and navigation performance. Coronal view of posterior medial temporal cortices between 0.25 and 1.25 s relative to trial onset, showing a peak negative correlation between differential theta activity (navigation minus sensorimotor control condition) and average path length taken to the hidden platform across 20 trials. Note that a negative correlation indicates greater theta activity in those who showed shorter average path lengths. Statistical maps are thresholded at p < 0.001 and overlaid on an averaged anatomical MRI in radiological view. Scatterplot with least squares lines represent the linear association between average path length and differential theta activity at the local maximum (coordinates in Talairach space).

