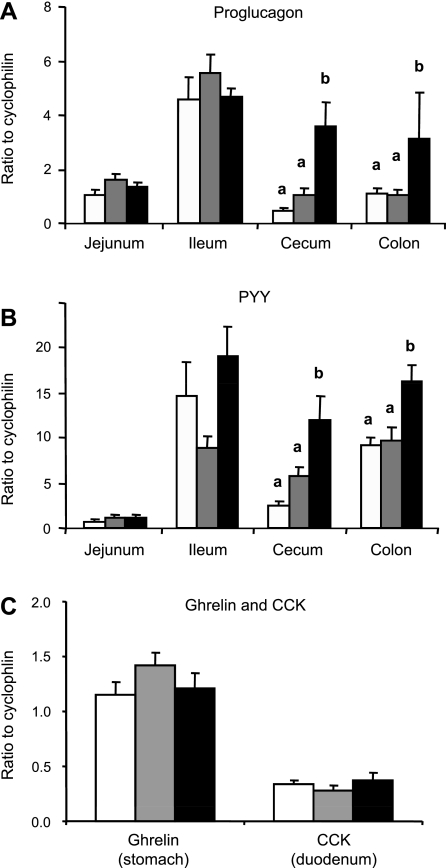
Fig. 2.
Proglucagon, PYY, and ghrelin and CCK gene expression in epithelial cells collected from different parts of the gut of rats fed control (open bars), nonfermentable fiber control (gray bars), and RS (filled bars) diets in study 2. Values are means ± SE for groups of 8–11 rats. Values that do not share a common letter (a, b) are significantly different (P < 0.05).

