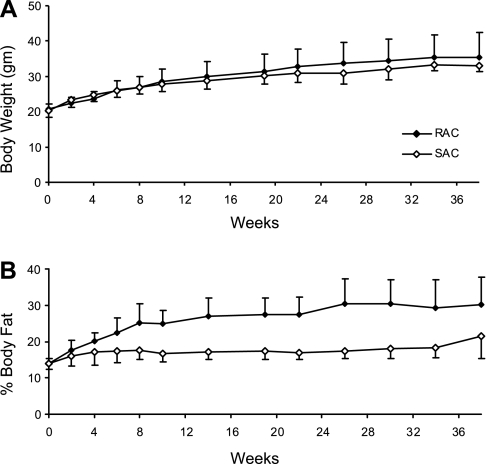
Fig. 2.
Mean body weight and composition for the RAC and SAC groups throughout the study. Mean body weight (A) and %body fat (B) are presented. Values are means ± SD, with 5–8 mice/group at each time point. Repeated-measures ANOVA, diet × time effect was P = 0.002 for body weight and P < 0.0001 for %body fat.

