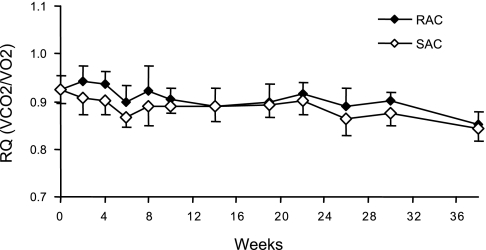
Fig. 3.
Mean respiratory quotient (RQ) for RAC and SAC groups throughout the study. All mice were fed the SAC diet for a 1-wk run-in period (week 0) followed by randomization to either the RAC or SAC diet. Each time point represents a 48-h measurement. Data are means ± SD with 13–16 mice/dietary group at each time point for weeks 0–19 and 6–8 mice/dietary group at each time point for weeks 20–38. Values, averaged across all time points, were significantly different between the RAC and SAC groups by t-test (0.91 ± 0.02 vs. 0.89 ± 0.01, P = 0.0002, respectively). V̇co2, carbon dioxide expiration; V̇o2, oxygen consumption.

