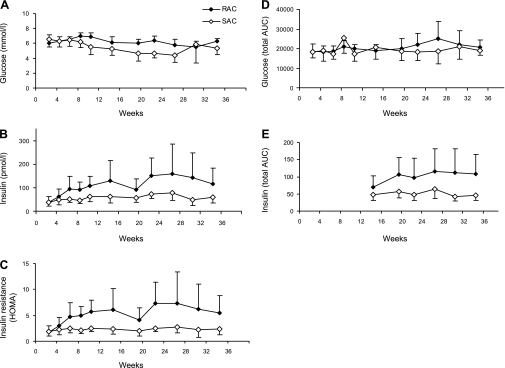
Fig. 4.
Assessment of insulin sensitivity by oral glucose tolerance test (OGTT) and homeostasis model assessment (HOMA) for RAC and SAC groups. Data for fasting blood glucose (P = 0.0003; A), fasting plasma insulin (P = 0.03; B), insulin resistance calculated by HOMA (P = 0.02; C), glucose area under the curve (AUC) during OGTT (P = 0.14; D), and insulin AUC during OGTT (P = 0.02; E). Values are means ± SD; n = 4–8/group at each time point. A–D: repeated-measures ANOVA (diet × time effect). E: mean values were averaged across all time points after randomization and compared by Student's t-test.

