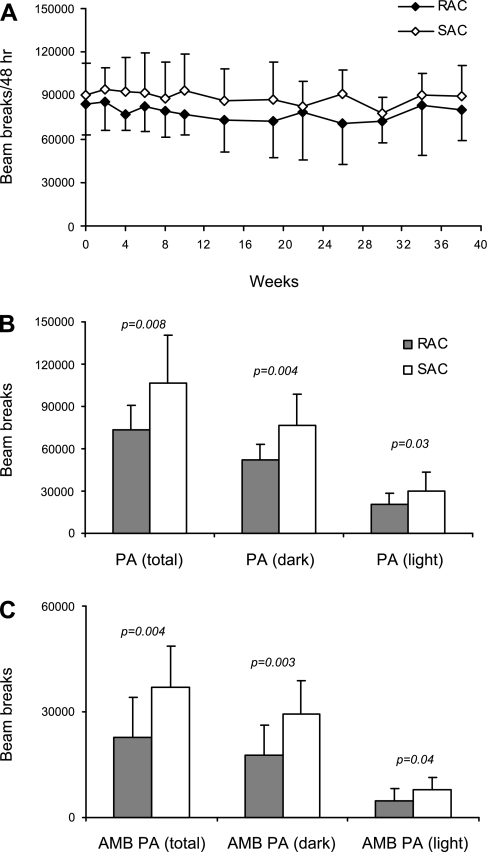
Fig. 5.
Physical activity (PA) during the 48-h CLAMS measurements for RAC and SAC groups. A: total PA is represented as total light beam breaks within 48 h. Values are means ± SD, with 13–16 mice/dietary group at each time point for weeks 0–19 and 6–8 mice/dietary group at each time point for weeks 20–38. Repeated-measures ANOVA, diet × time effect was P = NS. B and C: data for total PA and ambulatory (AMB) PA after 38–40 wk of feeding are shown. Values are means ± SD, with 12–15 mice/dietary group. Student's t-test. P values are indicated.

