Fig. 2.
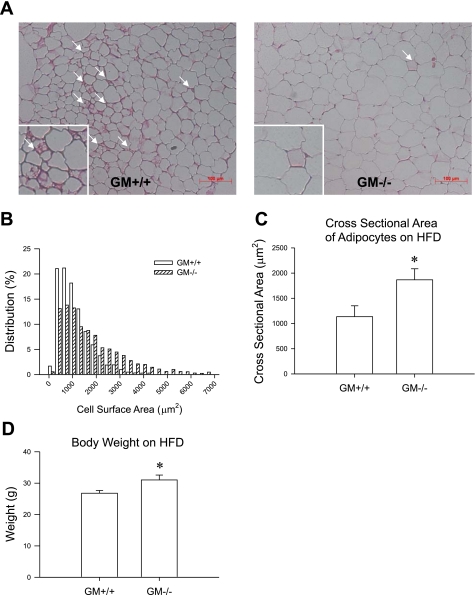
A: representative figures of adipocyte morphology in mesenteric fat of wild-type mice and GM-CSF knockout mice on a HFD. White arrows indicate crown-like structures. B and C: relative distribution of adipocyte size (B) and the cross-sectional area of the adipocytes (C) in mesenteric fat of wild-type mice and GM-CSF knockout mice on a HFD. D: difference of body weight in wild-type mice and GM-CSF knockout mice at 12 wk of HFD. *P < 0.05, wild-type mice vs. GM-CSF knockout mice.

