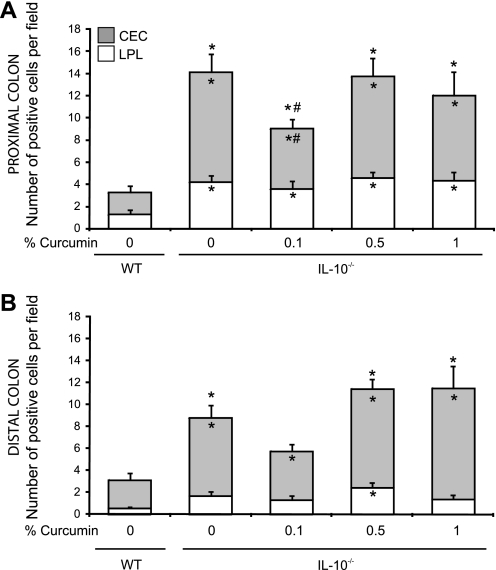
Fig. 8.
Scoring summary of phospho-Ser276p65-positive cells in the proximal (A) and distal colon (B) of WT or IL-10−/− mice fed control or curcumin-supplemented diets. Staining was scored by counting the number of phospho-Ser276p65-positive cells; colonic epithelial cells (CEC; open bars) and lamina propria (LPL; shaded bars) per high-power field of vision (magnification ×200). In total 5 randomly selected fields per section were analyzed for each mouse. Statistical analysis was performed with ANOVA followed by Fisher PLSD post hoc test. *Statistically significant differences (P ≤ 0.05) between control (WT, no curcumin) and respective dietary group of IL-10−/− mice. #Statistical difference between IL-10−/− mice on control diet and IL-10−/− mice on respective curcumin-supplemented diets. Differences are indicated for total number of phospho-Ser276p65 positive cells (CEC+LPL; outside the bars), in CEC (inside shaded bars), and in LPL (inside open bars).

