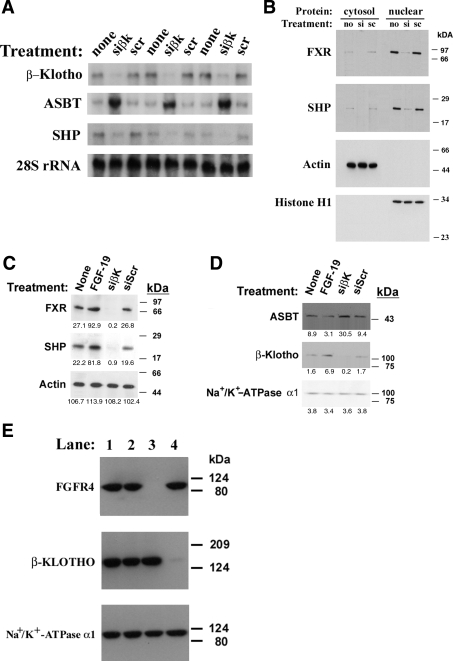
Fig. 1.
A: Northern blot analysis of siβ-Klotho-treated CT-26 cells. mRNA levels were measured via phosphorimager analysis of a Northern blot of 20 μg of total RNA after siβ-Klotho antisense (siβK) treatment for 40 h in 3 separate cell groups. 3 separate groups treated with scrambled antisense (scr) served as a control for the antisense treatment, whereas 3 additional groups of controls (none) were not treated. There was a 6-fold increase in steady-state apical sodium bile transporter (ASBT) mRNA levels and 70% reduction in steady-state short heterodimer partner (SHP) mRNA levels in the siβK-treated cells relative to either of the controls. Similar RNA loading is demonstrated by equivalent signals for 28S RNA. B: Western blot analysis of siβ-Klotho-treated CT-26 cells. Cytoplasmic or nuclear extracts were prepared from untreated (no), siβ-Klotho (si)-, and scrambled antisense (sc)-treated cells. Farnesoid X receptor (FXR) and SHP proteins were predominantly found in the nuclear extracts, and siβ-Klotho treatment reduced the expression of both of these proteins. Equivalent loading of cytoplasmic and nuclear proteins is indicated by the signals for actin and Histone H1, respectively. C and D: Western blot analysis of cytoplasmic (1C) extracts and membrane proteins (1D) from fibroblast growth factor (FGF)-19- or siβ-Klotho-treated human intrahepatic biliary epithelial cells (HIBEC). HIBEC cells were treated with either FGF-19 or siβ-Klotho, and then cytoplasmic extracts or membrane proteins were isolated. FXR and SHP protein abundance was induced by FGF-19 and repressed after silencing β-Klotho. FGF-19 treatment led to a reduction in ASBT expression, whereas β-Klotho silencing increased ASBT levels. Equivalent cytoplasmic and membrane protein loading is seen by the signals for actin or Na+/K+-ATPase-α1, respectively. Densitometric quantification of signal intensity is displayed below each protein band. E: Western blot analysis of siβ-Klotho and siFGF receptor (siFGFR)4-treated Caco-2 cells. Crude plasma membranes were prepared from cells that were untreated (lane 1), treated with siScr (lane 2), siFGFR4 (lane 3), or siβ-Klotho (lane 4). Marked reduction of the appropriate target proteins can be seen (antibody utilized in left column). Equivalent loading is indicated by the signal for Na+/K+ ATPase-α1.

