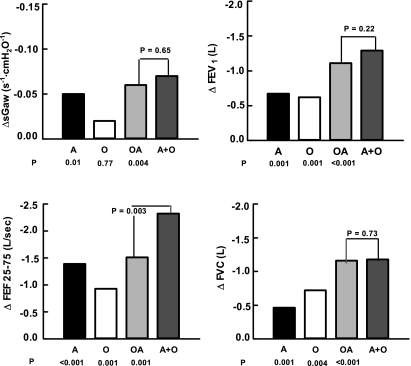
Fig. 1.
Comparison of the differences from normal for specific conductance and the spirometric variables. Bars represent mean values. ΔsGaw, differences in specific airway conductance; ΔFEV1, differences in 1-s forced expiratory volume; ΔFEF25-75, differences in the forced expiratory flows in the mid vital capacity range; ΔFVC, differences in forced expiratory volumes; A, asthmatic subjects; O, obese subjects; OA, coexistence of obesity and asthma in subjects; O+A, the sum of the differences found with A and O subjects in isolation. P values below each bar represent comparisons with normal; whereas the P value in the graph is derived from comparisons of the OA and O+A values.

