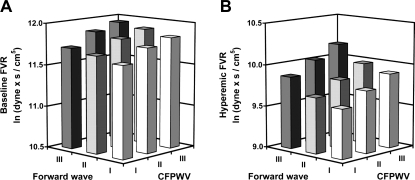
Fig. 3.
Forearm vascular resistance (FVR) at rest (A) and during hyperemia (B) induced by 5 min of forearm ischemia. Data are least square means of natural log-transformed FVR, plotted according to tertiles of carotid-femoral PWV (CFPWV) and forward pressure wave amplitude, and adjusted for age, sex, body mass index, heart rate, total-to-high-density lipoprotein cholesterol ratio, triglycerides, fasting glucose, prevalent cardiovascular disease, diabetes, use of lipid-lowering or antihypertensive therapy, smoking, hormone replacement in women, timing of walk test. and daily aspirin use. [Reproduced with permission from Mitchell et al (65).]

