Fig. 1.

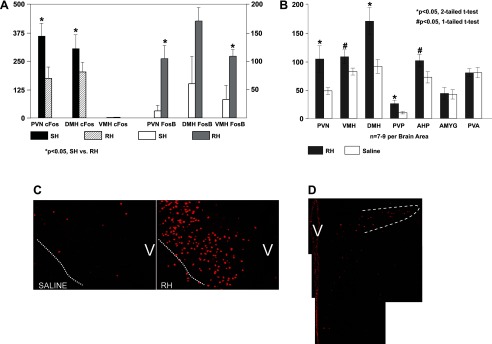
Recurrent hypoglycemia (RH) induces FosB expression. A: quantitative comparison of c-Fos (axes on left) and FosB (axes on right) cell counts following single hypoglycemic (SH) and RH in the paraventricular nucleus (PVN), ventromedial hypothalamic nucleus (VMH), and dorsomedial hypothalamic nucleus (DMH). B: FosB immunopositive neuron counts following three infusions of saline or insulin. Statistically significant increases in the number of FosB-positive cells in the RH-treated group compared with the saline control group were observed in all of the hypothalamic areas indicated and the posterior PVN of the thalamus (PVP). FosB expression was not increased in the other brain areas, as evaluated by either one- or two-tailed t-tests (hypothesis: increased FosB expression in RH- vs. saline-treated rats, one-tailed t-test; change in either direction of FosB expression in RH- vs. saline-treated rats, two-tailed t-test). C: immunofluorescence images taken at mid-PVN levels illustrating the expression of FosB in the PVN of a RH-treated rat (right) compared with a saline-treated rat (left). The dotted white line demarcates the ventral perimeter of the PVN, whereas “V” is placed over the region of the ventricle. D: immunofluorescence image of the caudal PVN; the dotted white line demarcates the lateral parvocellular subdivision.
