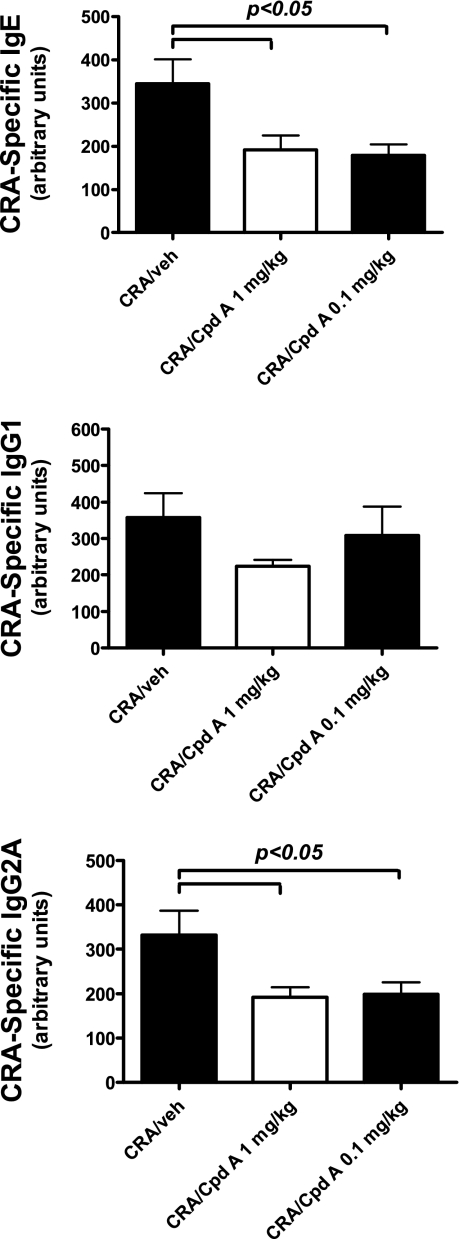
Fig. 6.
Levels of CRA-specific IgE, IgG1, and IgG2a from challenged mice with and without drug treatment. CRA-specific IgE levels were quantitated by comparison to a standard curve for absolute units; antigen-specific antibody levels are in arbitrary units. Mice were treated with 2 different concentrations of Compound A, 10 and 0.1 mg/kg. Each column and error bars display the means ± SE. A minimum of 5 mice/treatment group was analyzed, and representative results from 3 independent experiments are shown.

