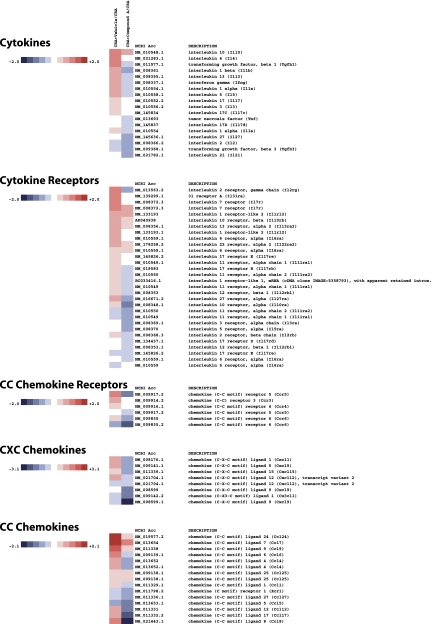
Fig. 7.
Heatmap of select genes downregulated in CRA-challenged mice treated with Compound A. Total RNA was extracted and analyzed using Illumina bead arrays. Levels of gene expression were investigated in 3 experimental groups, CRA treated, CRA + vehicle, and CRA + compound A, as outlined in the text. Data for the vehicle and drug treatments are presented as a fold increase or decrease relative to mice treated solely with CRA. The data array is representative of 3 independent experiments (biological replicates). The fold changes are noted on the respective color scales. In this clustergram, genes are grouped into cytokines, cytokine receptors, CC chemokines, CC chemokine receptors, and CXC chemokines.

