Fig. 6.
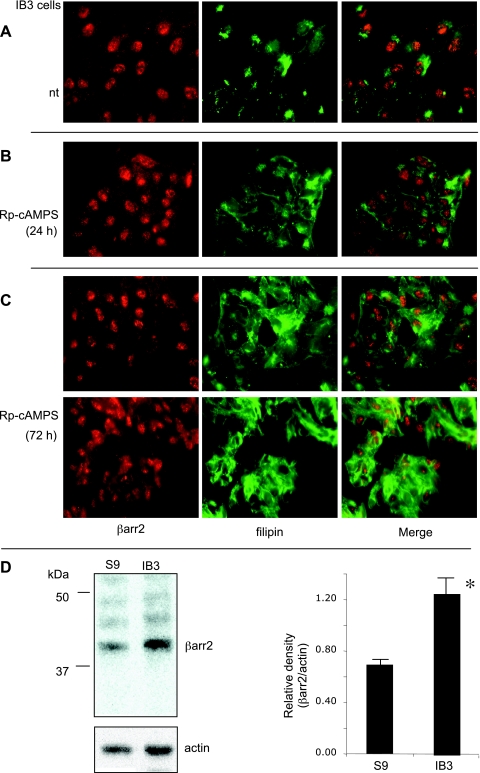
Correction of cholesterol transport in CF model IB3 cells with Rp-cAMPS. A: representative image of IB3 cells costained for βarr2 and endogenous free cholesterol (filipin). B: representative images of CF model IB3 cells costained for βarr2 and cholesterol (filipin) treated with Rp-cAMPS (50 μM) for 24 h. C: 2 representative images of CF model IB3 cells costained for βarr2 and cholesterol (filipin) in the presence of Rp-cAMPS (50 μM) for 72 h. Images are representative of at least 17 images for each condition taken over duplicate experiments. Control studies using secondary antibody only were performed to ensure images represent primary antibody binding. No staining was observed in control images (not shown). D: representative gel showing βarr2 and actin expression in S9 (WT) and IB3 (CF model) cells and densitometry analysis of βarr2 protein expression normalized to actin content. Significance was determined by t-test (n = 3; *P = 0.005).

