Fig. 3.
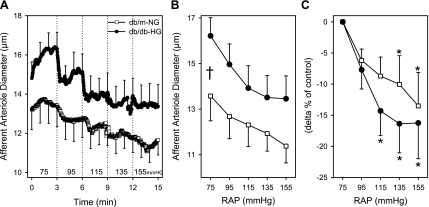
AA diameter responses to elevations in renal arterial perfusion pressure (RAP) in kidneys of db/m and db/db mice. Kidneys from db/m mice (db/m-NG; n = 12) were incubated in euglycemic (5 mM glucose; NG) perfusion and superfusion solutions, while kidneys from db/db mice (db/db-HG; n = 11) were incubated in hyperglycemic (30 mM glucose; HG) solutions. AA diameter responses to stepwise increases in RAP are plotted as the time course (A), average in micrometers (B), and Δ% of control (C). AA from db/m-NG and db/db-HG kidneys responded to increases in perfusion pressure with a significant reduction in diameter (P < 0.05). The magnitude of the AA vasoconstrictor responses (Δ% of control) was not significantly different between db/m-NG and db/db-HG kidneys. Data are means ± SE. *P < 0.05 vs. diameter at 75 mmHg; †P < 0.05 db/m-NG vs. db/db-HG.

