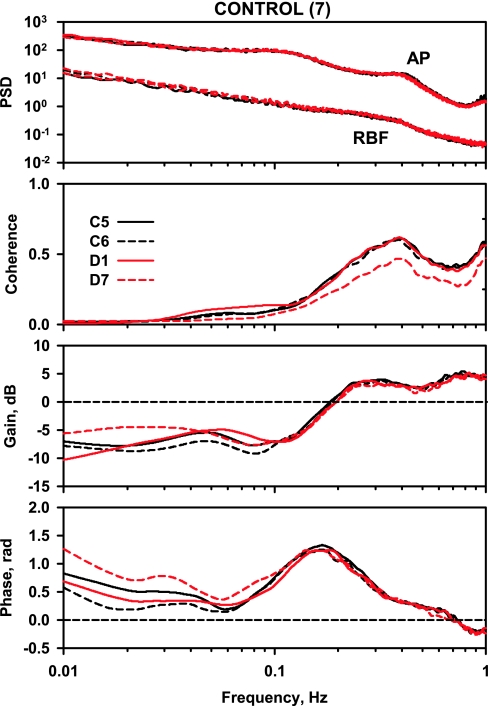
Fig. 3.
Power spectra for arterial pressure (AP) and renal blood flow (RBF), coherence, gain, and phase in the control rats. In each panel, the solid black line represents day 5 of the control period (C5), the dashed black line represents day 6 of the control period (C6), the solid red line represents day 1 of the diabetes period (D1), and the dashed red line represents day 7 of the diabetes period (D7).

