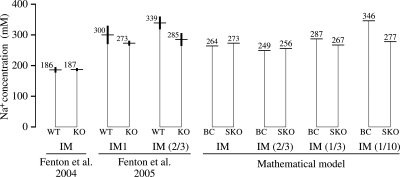
Fig. 14.
Tissue sodium concentrations in IM: comparison of findings by Fenton et al. (11, 12) in wild-type (WT) and UT-A1/A3-null mice (KO) with analogous base-case (BC) and simulated knockout (SKO) results from pipe mode model for the rat. IM indicates whole inner medulla; IM1 indicates the base of the inner medulla; fractions indicate inner fractional portions of IM. Concentrations are labeled in each instance; thick vertical line segments represent SE. None of the Na+ concentration differences between WT and KO were judged to be significant by Fenton et al. (11, 12).

